Methodology
One of the challenges of mapping innovation at
Virginia Tech and in its
surrounding communities was developing a methodological rationale. What
kinds of data would we need to accomplish our project’s objectives? Who would
we talk to and why? Would we seek to obtain a representative sample? Would we
attempt to engage the vast quantities of data made available by the Internet?
These were just some of the questions we had to wrestle with over the course of
the semester. Here’s how we decided to tackle these and other challenges.
1. Interviews
We wanted to speak with those “strategically located” individuals most would commonly identify as engaged in “innovative” activity: for instance, researchers and scholars at Virginia Tech’s Institute for Creativity, Arts, and Technology (ICAT) as well as members of the Center for Innovation-based Manufacturing (CIBM) team. However, we also wanted to reach out to members of the Virginia Tech community that were in departments and at organizations on campus not necessarily considered innovative by those subscribing to the dominant discourse. Finally, we sought to target individuals not associated with Virginia Tech in the surrounding communities. Kristen Koopman from the Data Collection team explains how the data was collected in this short video below.
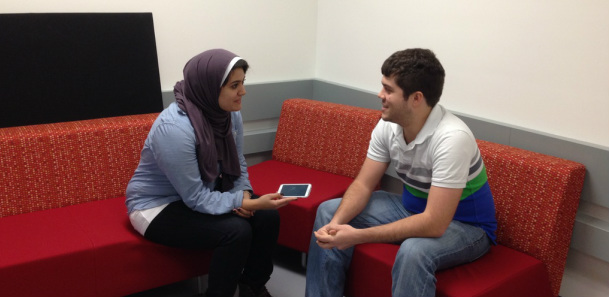
1.1 Micro-Interviews
|
Over several weeks, the team interviewed 43 people around the Virginia Tech Community. The graphs below and to the right present demographic data about this sample. Interviewees were recruited from across the Virginia Tech campus, including students, staff, and Blacksburg residents. We tried to target two kinds of interviewees:
|
|
|
Although considerable effort was made to interview a wide demographic, the majority of the interviewees (79 percent) were between the ages of 18 and 35. Similarly, only 3 of the 43 individuals interviewed were not affiliated with Virginia Tech in any way; the remaining interviewees had some kind of connection to the University.
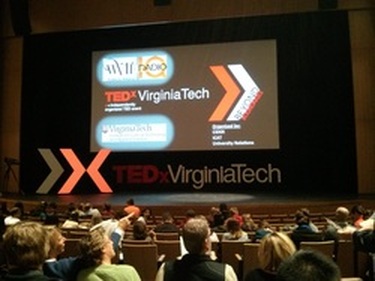
Completing a total of 43 interviews, these short, three to five minute survey questionnaires were conducted at a diverse array of sites across the Virginia Tech campus and beyond. Such sites included the Blacksburg Farmer's Market, the InnovationSpace at Torgersen Hall, Newman Library, the Robotics & Mechanisms Laboratory (RoMeLa) and TEDx at Virginia Tech (pictured on the right). |
|
The micro-interview protocol was designed to obtain demographic information (age, job title, etc.). It was also designed to elicit data concerning how "innovation" is thought of and defined locally, that is to say, individually and on a case-by-case basis.
|
The micro-interviews comprised of the following questions:
|
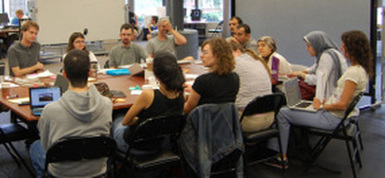
The team brainstorming potential interview questions.
|
1.2 Key Informant Interviews
Alongside the dozens of completed micro-interviews, several members of the data collection team targeted special key informants for longer, more open-ended discussions. We had two
types of experts:
- People who “manage” innovation places: who helped us understand how to manage innovation among team members, how innovation process can be standardized, and the bird’s eye view of what’s happening in VT to support (or to hinder) innovation.
- People who “do” innovation: who helped us to know about the “innovation process”, where do ideas come from, and how to transform ideas into actions.
|
The key informant segment of the Mapping Innovation research project sought both to compliment and expand upon recurring themes identified in the micro-interview data. These extended interviews were scrutinized using discourse analysis by members of our team. Taking into consideration the breadth allowed by the micro-interviews and depth of the key informant discussions, a robust and well-rounded field of data began to emerge.
Dr. Jaime Camelio, on the right, is head of the Center for Innovation-based Manufacturing (CIBM) at Virginia Tech. He is one of several strategically positioned "innovators" that agreed to a key informant interview. (Picture courtesy of the VT website.) |

Dr. Jaime Camelio, Head of the Center for Innovation-Based Manufacturing (CIBM) at Virginia Tech.
|
The selection of participants for the key informant and microinterviews determined the kinds of data that we were able to gather. These selections were conducted with both research goals and practicalities in mind. In the audio clip above, one team member discusses the consequences of our data collection and our privileging of innovative activities occurring at Virginia Tech over those within the larger community.
2. Site Visits
As we noted earlier, however we define the word "innovation," it is nevertheless happening all around us, assuming myriad shapes and sizes. Over the course of several months, members of our team set out to discover just what innovation looks like on the ground. We visited numerous sites both across and beyond Virginia Tech, attended special events, talks, and workshops, took field notes, spoke with scientists, scholars, entrepreneurs, and non-academics alike, and brought all of our experiences back to the round table. Below are just a handful of the sites we engaged:
- Talk by physicist, former United States Secretary of Energy, and Nobel Laureate Steven Chu at VT
- Workshop at the Center for Innovation-based Manufacturing (CIBM)
- Visit to the Robotics and Mechanisms Laboratory (RoMeLa)
- Visit to the Virginia Tech Transportation Institute (VTTI)
It was a rich and interesting experience for me to participate in most of the site visits during this project. I've met some of the brilliant minds of VT, and I've known a lot about research activities that I couldn't have had access to if it were not for this project. I believe that VT has very strong research groups that are not known to the community, and I think that their work should be advertised and publicized. One of the goals of this project for me is to discover where innovation happens at VT, and I think that the site visits helped us to get a primary answer for this question, and I believe that this website will be one of the means to help VT innovators reach out to the community.
Seyam, Project Team Member
3. Twitter Data Mining
With copious amounts of information streaming in from all of the above-mentioned endeavors, members of our data analysis team have been working with members of our data collection team to organize and process the raw material as it's obtained. Additionally, members of the former group have also been engaged in efforts to widen the scope of our research to include data from sources other than those directly and indirectly associated with Virginia Tech. For instance, members of our team have also collected tens of thousands of tweets that either contain the words innovation, innovative, or innovate in order to determine the frequency with which such such keywords are used.
4. Analytical Methods
After gathering data about innovation from various sources, the Data Analysis team explored the data using various techniques, both qualitative and quantitative. The first step was to conduct background research using scholarly works on innovation. Then a qualitative data analysis was performed. This required looking through all of the interview data - both key informant and microinterviews - and identifying elements of the data which related to concepts found in the literature. Statements which corresponded to those found in literature were identified as "dominant lenses" of innovation. Statements which opposed established concepts were called "challenging lenses".
Statistical data analysis and visualizations were also performed. After certain themes and key words were identified by the qualitative data analysis, the interview data was used to represent this data in different ways. Word clouds and heat maps showed which words were used most often by the interview participants. Dendrograms represented the ways in which different words were used in combination. Josh and Annie from our analysis team describe their different analytical methods in the video below.
Statistical data analysis and visualizations were also performed. After certain themes and key words were identified by the qualitative data analysis, the interview data was used to represent this data in different ways. Word clouds and heat maps showed which words were used most often by the interview participants. Dendrograms represented the ways in which different words were used in combination. Josh and Annie from our analysis team describe their different analytical methods in the video below.